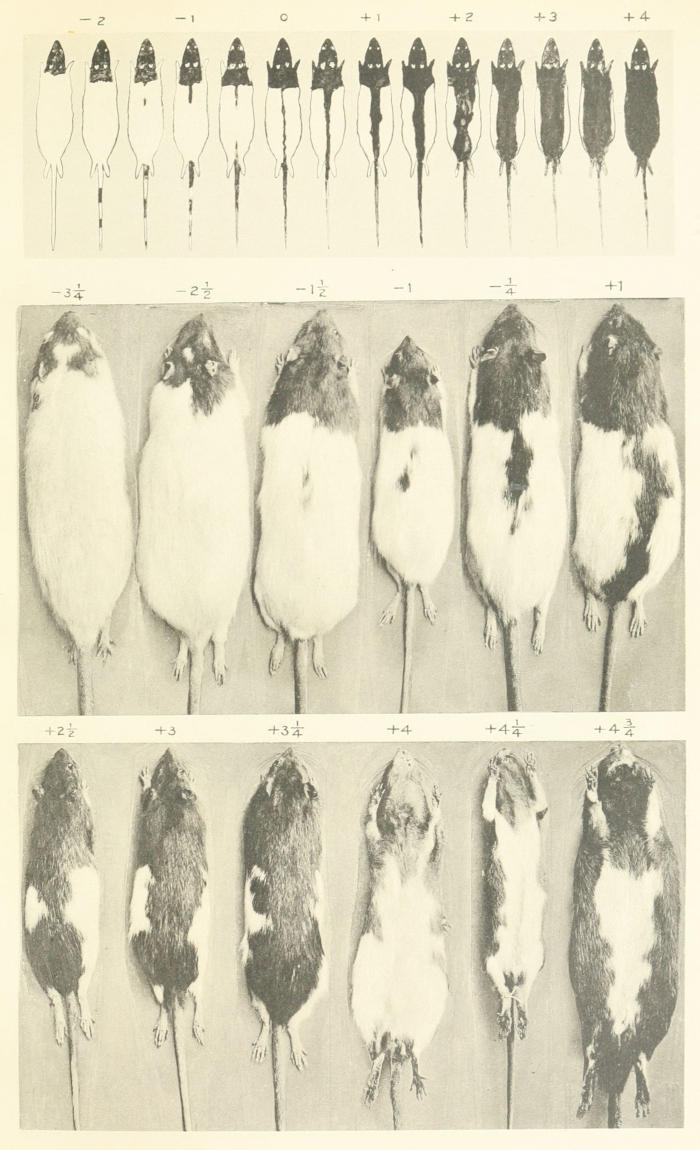
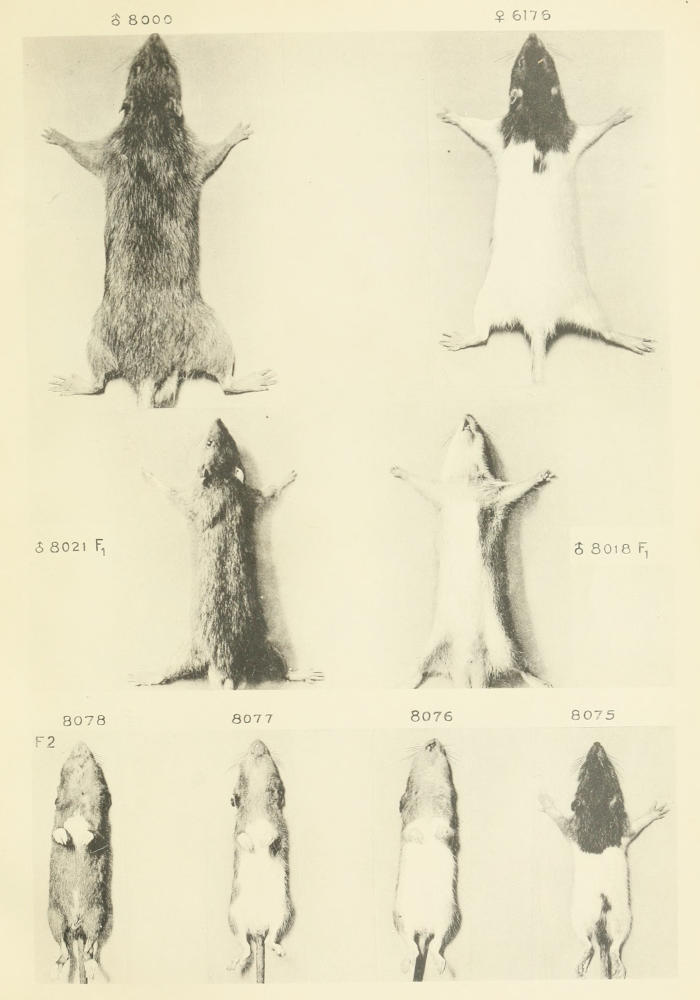
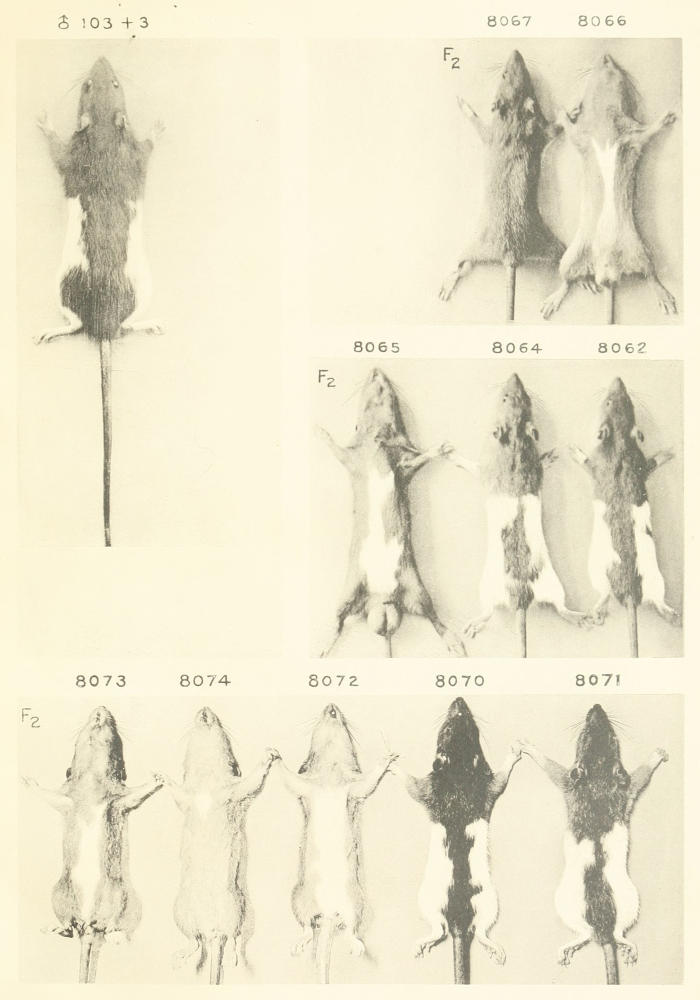
In the tenth generation of the plus selection series there appeared two
individuals, a male and a female, of considerably higher grade than any
previously recorded in this series. They are not included in Table 10
because we have been and still are in doubt as to their exact nature and
think it best to give a separate account of them. If entered in Table 10
one would appear as a 5½ individual born of 3⅞ parents (mean grade),
the other as a 5¾ individual born of 3¾ parents (mean grade). The
nearest individuals in grade to these two produced by the same group
of parents are of grade 4½, but some 4⅛ parents of the same generation
produced two offspring of grade 5. (See Table 10.) Because of the
marked advance in grade of these individuals beyond the ordinary
range of variation in the series we called them “mutants,” without
wishing then or now to commit ourselves to any particular theory as to
their nature or origin. We have used the term and now use it as one of
convenience merely. The two “mutant” individuals had the same
father and their mothers were sisters. Their pedigree for two generations
is as follows:
| Mutants. |
Parents. |
Grandparents. |
| ♂ 4763, +5½ |
{ |
♀ 2956, +3¾ |
} |
{ |
♀ 1939, +3¾ |
| { |
♀ 2957, +3½ |
} |
{ |
♂ 1817, +3¾ |
|
{ |
|
|
|
|
| ♀ 5153, +5¾ |
{ |
|
|
{ |
♀ 1162, +3½ |
| { |
♂ 2963, +4 |
|
{ |
♂ 1810, +3¾ |
The mutant male was mated with the mutant female and also with
other females of the plus series, with the results shown in Table 51. In
every case the young fall into two distinct groups, one of which varies
about the general mean of the plus series (approximately 3¾), while the
other varies about the father’s grade as a mean (approximately 5½).
The mutant female had 16 young, 6 in the lower group, mean 3.87,
and 10 in the upper group, mean 5.60. (See Table 51, lowest row.)
The other females had in all 114 young almost equally divided between
the two groups, 58 in the lower group, mean 3.73, and 56 in the upper
group, mean 5.45. This result indicates clearly (what the sequel also
confirms) that the male mutant transmitted in half his gametes the high
grade of pigmentation which he himself manifested, while in the other
half of his gametes he transmitted the ordinary condition of the plus
race at that time. In other words his “mutant” character behaved as
a dominant unit in relation to the ordinary condition of the plus race.
It is evident that the female mutant was of similar constitution.
This being the case, we should expect three-fourths of the offspring of
the two mutants to be in the upper group. In reality 10 of their 16
young were of this sort.
The male mutant was mated also with females of the minus series
with the results indicated in Table 52. Again, the offspring fall into
two distinct groups, a lower and an upper. The lower group should be
comparable with the result obtained in F₁ when the plus and minus
races are crossed with each other. (Compare Table 50.) Such it
proves to be. It includes 35 individuals of mean grade -0.49 and
standard deviation 0.77. Series 2 of Table 50 is nearly contemporaneous
with this experiment. The F₁ offspring in that series were of
mean grade -1 and standard deviation 0.60.
The upper group of offspring (Table 52) result, we may suppose,
from a mutant gamete (grade about 5½) united with a narrow series
gamete (grade about -2). This group includes 31 individuals varying
closely about grade 4½, and with a standard deviation of only 0.31.
The lower average grade of this group (4.43) compared with the similar
group of Table 51, which had a mean of 5.47, shows the influence of
the minus-series gamete upon the heterozygote in lowering its grade by
about 1. Whether the plus-series gametes have any effect upon the
grade of the heterozygotes recorded in the upper group of Table 51 is
not certain, because a homozygous group of mutants has not yet been
established. It may be observed, however, that one individual in the
upper group of Table 51 was of grade 6 (colored all over), and it is possible
that homozygous “mutants,” when obtained, will approximate
that grade, as most wild rats do. Further, a comparison of Tables 51
and 53 shows that mutant heterozygotes formed by crosses with the
plus series are of slightly lower mean grade than the offspring of the two
mutants, among which should occur both homozygous and heterozygous
mutants. It seems probable, therefore, that homozygous mutants will
be found to be of somewhat higher grade than heterozygous ones.
The question early suggested itself to our minds, will these “mutants”
prove to be mutants in the sense of De Vries? Will they prove to be
more stable than the modifications ordinarily secured by selection in our
experiments? To test this matter, we have raised two additional generations
of offspring from the two mutants and have bred a second
generation of offspring from each of the four groups of F₁ offspring
recorded in Tables 51 and 52, derived from matings with the plus and
minus races respectively.
The F₂ descendants of the two original mutants proved very similar
to the F₁ descendants. (See Table 53.) They fall as before into two
groups, an upper and a lower. The former includes 30 individuals of
mean grade 5.52, the latter 2 of mean grade 3.37. As the parents of
this generation were taken wholly from the upper group of offspring of
generation F₁, and as theoretically that group should contain 2 heterozygous
individuals to one which is homozygous for the “mutant” character,
it is to be expected that in F₂ more than three-fourths of the
offspring will fall in the upper group. For any pair, one member of
which is homozygous for the mutant character, should produce only
offspring falling in the upper group; and offspring falling in the lower
group should be produced only by pairs both members of which are
heterozygous.
The upper group in F₂ should contain a larger proportion of homozygous
mutants than in F₁, and since the parents of F₃ were chosen from
this upper group of F₂ offspring, it is not surprising that the 11 F₃ offspring
recorded up to this time all fall in the upper group. The mean
of this upper group is remarkably constant through the three generations,
and the variability of the group as measured by its standard
deviation is also low, namely, 0.19. This indicates that the mutant
character is a strongly dominant unit in relation to the ordinary condition
of the plus series.
Table 54 shows the character of the F₂ offspring of the original male
mutant mated with females of the plus series. The lower group
parents, those into which the mutant character did not presumably
enter at all, produced 59 offspring recorded in the first part of Table 54.
Their mean grade is 3.78 and their standard deviation 0.33. These are
very close to the constants of the general plus series, which for generation
10 were 3.73 and 0.36, respectively.
The second division of Table 54 shows the character of the young
produced by the F₁ parents of the upper group (Table 51). Such
parents are supposed to have received a “mutant” gamete from their
father, grade about 5.50, and a plus-series gamete from their mother,
grade about 3.75. If they produce gametes of these same two sorts, their
offspring should also fall into two corresponding groups; in fact they do.
There are 11 offspring of mean grade 3.86 and 79 offspring of mean
grade 5.50. As in the previous generation, the two groups do not
approach each other in grade. The mean and standard deviation of
the lower group of offspring are similar to those of the plus race. The
mean of the upper group is about the same as that of their parents
(upper group of offspring, Table 51), namely, 5.50, as compared with
5.45; their standard deviation is somewhat lower, namely, 0.15, as compared
with 0.23. This result indicates that the “mutant” character
and the hooded character of the plus series segregate from each other in
a simple way without modifying each other appreciably. It seems
possible that they contain the same modifiers (if modifiers are present)
and differ merely by the main unit which we called the hooded character
in the early part of this paper. Each contains a different condition of
that main unit. Consequently there is no increase of variability in F₂
when these two conditions are intercrossed. This we should expect to
happen, if they differed by more than a single factor.
A very different result is obtained from the cross between the mutant
and narrow races. Although F₁ from that cross was quite variable
(see Table 52), F₂ is still more variable (see Table 55). The lower
group F₁ individuals, which resembled F₁ between the plus and minus
races, produced 61 young (first division of Table 55), which resemble
F₂ between the plus and minus races. They range in grade from -2
to +3¼, mean +0.58, standard deviation 1.17. In the two series of
crosses between the plus and minus races (Table 50) the means were
+0.24 and +0.72, respectively, and the standard deviations 1.01 and
0.87. This indicates, as did the cross with the plus series, that the
“lower group” gametes produced by the original mutant male did not
differ materially from gametes produced by the ordinary plus race from
which the mutant sprang.
The second division of Table 55 shows the character of the F₂ young
produced by the upper group of F₁ offspring recorded in Table 52. It
consists of two groups, a lower and an upper. The lower represents
the extracted minus race, the upper represents the extracted dominants
or mutants, whether homozygous or heterozygous. The former group
has an average of +0.75 and a standard deviation of 1.03, which values
are close to the corresponding constants of Series 2, Table 50, the
latest of the plus-minus crosses, in which the mean was +0.72 and the
standard deviation 0.87.
The upper group offspring of Table 55, second division, the homozygous
and heterozygous mutants, number 68; they have a mean grade
of 4.77 as compared with 4.43 in F₁, which consisted exclusively of
heterozygotes. This shows the extracted homozygotes to be of higher
grade than the heterozygotes. The highest grade mutant among the
31 F₁ young, all of which were heterozygotes, was of grade 5, but among
the 68 F₂ young are 16 of higher grade than 5. We expect one-third of
these 68 individuals to be homozygotes. Now all of the F₂ mutants
from the cross of mutant with plus race (Table 54) were of grade 5 or
higher, only 2 in 79 being as low as 5, and 13 of the 79 being of grade 5¾,
a grade not attained at all in F₂ from the mutant-minus cross (Table 55).
This result shows us that the cross with the minus race does affect permanently
the mutant character, lowering its grade even in homozygous
mutants extracted from the cross. It also increases the variability of
the mutants, for the standard deviation of the mutant group in Table
55 is 0.44, whereas in Table 54 (mutant-plus F₂), in a like number of
individuals, it was 0.15, or only about one-third as great.
That the variability of the mutants is unaffected by a cross with the
plus race, but that it is increased by a cross with the minus race, and
that, further, the mean of the mutants is affected little or none by a cross
with the plus race, but that it is lowered by a cross with the minus race—these
several facts are all conformable with the hypothesis that the
change in variability due either to crossing or to selection results from modifying
factors which, as they are independent of the main factor concerned,
are probably transmitted in a different part or component of the germ-cell
than that factor. For if the mutant and the plus race are alike as
regards the modifiers, but differ only in the main factor, then no change
in variability should result from intercrossing them, but only alternative
conditions as regards the main factor. This is the observed result.
But if the mutant and the minus race differ not only in the main factor,
but also in modifiers which are independent of it, then, when they are
crossed, we may expect that through independent segregation of main
factor and modifiers the extracted minus race will be raised in grade,
while the extracted mutants are lowered, and both will become more
variable. This also is the observed result.
One objection may be offered to this interpretation, namely, that
the increased variability is not delayed until F₂, but is already in evidence
to some extent in F₁. The same thing was observable in the
crosses of the plus and minus series (Table 50). From that table,
Series 1, it will be observed that when the plus and minus races had
standard deviations of 0.49 and 0.50, respectively, their F₁ offspring had
a standard deviation of 0.71, an increase by nearly one-half; F₂ showed
a further increase to 1.01. In series 2, Table 50, the uncrossed races
(generation 10) had standard deviations of 0.36 and 0.24; their F₁ offspring
had a standard deviation of practically twice this, namely 0.60;
F₂ showed a further increase to 0.87.
At the time of the mutant-minus race crosses, the minus race (generation
10) had a standard deviation of 0.24, the plus race of 0.36. F₁
(lower group) had a standard deviation of 0.77, and F₂ of 1.17. F₁
mutants (upper group) had a standard deviation of 0.31 which rose in
F₂ to 0.44. These various facts will perhaps be better grasped if presented
in tabular form:
|
Standard deviation
of races crossed, same
generation. |
S. D. F₁ |
S. D. F₂ |
| Plus-minus cross, series 1 (Table 50) |
0.49 |
0.50 |
0.71 |
1.01 |
| Plus-minus cross, series 2 (Table 50) |
.36 |
.24 |
.60 |
.87 |
| Mutant-minus cross, lower group |
.25 |
.24 |
.77 |
1.17 |
| Mutant-minus cross, upper group |
.19 |
.24 |
.31 |
.44 |
| Mutant-plus cross, lower group |
.25 |
.36 |
.24 |
.35 |
| Mutant-plus cross, upper group |
.19 |
.36 |
.23 |
.15 |
The mutant-plus cross, it will be observed, shows no increase of variability
either in F₁ or in F₂, but crosses involving the minus race show
increase of variability both in F₁ and in F₂. Interpreted on a Mendelian
basis, this means that the mutant and plus races on the one hand and the
minus race on the other hand differ by more than a single factor. If
they differed by only a single factor, then crosses between them should
bring no increase of variability, either in F₁ or in F₂. This appears to
be true as regards the mutant and plus races when crossed with each
other. But if the races crossed differ by more than one factor, and if,
further, neither parent is homozygous as regards the factors in which
they differ, then we may expect an increase in variability both in F₁ and
in F₂. This is exactly what we observe when the minus race is crossed
with either the plus race or its derivative, the mutant race.
If we suppose that the plus race and the minus race differ from each
other by certain “modifiers,” we can not suppose that the plus and the
mutant races differ by these same modifiers. They differ in some other
single respect; perhaps that in which they differ is the main hooded
factor. Are we, then, to suppose that the plus and the minus races do
not differ as regards this same main factor? This can not be stated, but
we see no reason for considering them identical as regards that factor.
It appears that the mutant race arose from the plus race by a single
large plus variation, which seems to have its determiner in some single
component of the germ-cell. But the fact that this change came as a
large quantitative variation does not show that small variations are
impossible in that same cell component. It seems to us quite improbable
that the plus mutation could have arisen in the minus selection
series. We believe that the repeated selection which was practised had
something to do with inducing this change in the plus direction. If
one can increase at will the “modifiers” which make the pigmentation
more extensive, it does not seem strange that after a time a readjustment
should occur within the cell which should incorporate modifiers
in that part of the cell which is responsible for the unit-character
behavior of the hooded pattern. This would amount to a quantitative
change in the unit-character for hooded pigmentation.