Need of maps. Maps are useful and necessary for
many purposes. Only by means of a correct map
or globe can a clear idea of the geography of a region
be given. An attempt to convey the same information
by a written description would in comparison be both
cumbersome and obscure. Even by passing over an
extensive region a man unaided by instruments will
obtain only a rather crude notion of the relations, which
he could clearly see on a good map. The importance
among the human arts of the making of maps is indicated
by the references to them in very early historical
records, and by the skill in map drawing shown by
some of the primitive peoples of to-day. This skill
exists particularly among races whose mode of life
gives them a wide horizon, as for instance the Eskimos.
An interesting instance of this was the case of Joe, an
Eskimo guide, who, in 1898, before the surveys of the
Yukon delta were made, drew a map of the Yukon
mouths with much more complete information than any
previously available.
Without attempting to enumerate in detail the special
uses for maps, in the broader sense they may be said
to be essential for commercial, engineering, military,
scientific, educational, and political purposes.
Early geography and map making. The oldest map
known is a plan of gold mines in Nubia, drawn on a
papyrus. This is of the thirteenth century B.C., and
was found in Egypt.
In the earliest historic times men believed the earth
to be a flat surface of nearly circular outline, a natural
inference for those with limited outlook and communication.
Later the idea was introduced of the ocean as
a river bounding the earth disk. The spherical theory
of the earth was, however, early accepted by learned
men, and was demonstrated by Aristotle (384 to
322 B.C.), who used as proofs the earth's shadow on the
moon, and the change in the visibility of the stars in
traveling north or south. Crates constructed a terrestrial
globe in the second century B.C.
There is no Greek or Latin map extant of earlier
date than the time of Ptolemy, but there are references
showing that maps were in use. One of the first of
such passages in Greek literature is the interesting
comment of Herodotus written in the fifth century B.C.,
"but I laugh when I see many who already have drawn
the circuits of the earth, without any right understanding
thereof. Thus they draw Oceanus flowing round the
earth, which is circular, as though turned by a lathe,
and they make Asia equal to Europe."
A map of the world was drawn by Anaximander,
560 B.C. A hundred years later Democritus drew a
map having an oblong shape, and taught that the width
of the world from east to west was one and a half times
its extent from north to south, a conclusion based on
his travels eastward as far as India. This theory,
which was for a time accepted, has left an enduring
mark in the words longitude and latitude, originally
signifying the length and the breadth of the earth.
The first application of astronomy to geography was
made by Pytheas, who about 326 B.C. obtained the latitude
of Marseilles by an observation of the altitude of the
sun. Dicearchus in 310 B.C. determined the first parallel
of latitude by noting places where on the same day the
sun cast shadows of equal length from pillars of equal
height. Eratosthenes (276 to 196 B.C.) was the first
to compute the circumference of the earth from observations
of the altitude of the sun at Alexandria and at
Syene in Upper Egypt and an estimation of the distance
between these two places. Ptolemy, a Greek of Alexandria,
in the years from 127 to 151 A.D. wrote extensively
on geographic subjects, and collected into systematic
form all geographic knowledge then existing; he was
the greatest geographer of early history.
In the ten centuries which followed, part of the early
advance in this science was obscured, and the theory
that the earth was a flat disk surrounded by the sea
again became prevalent. The voyages of discovery
of the middle ages, however, led to a rapid development
of geographic knowledge.
The flattening of the spherical earth was not suspected
until in 1672 a clock regulated to beat seconds
at Paris, when taken to Cayenne near the equator was
found to lose two and one-half minutes a day. Newton
proved that this was due to the fact that the earth
is an oblate spheroid. In 1735 accurate measurements
were undertaken to determine the size and shape of
the earth. The equatorial diameter has been found
to be 7926.6 miles and the polar diameter 7899.6 miles,
the difference, or 27 statute miles, being the amount of
the flattening at the poles.
The first sailing directions. The early Greek and
Roman writers do not allude to charts or maps intended
especially for the use of seafarers. There are, however,
extant several peripli or descriptions of the coast. Some
of these appear certainly to have been intended for use
as nautical guides, corresponding to the modern sailing
directions. It is probable that they were explanatory
of or accompanied by coast charts, now lost.
They are of interest therefore as being probably the first
compilations for the guidance of seamen. One of the
earliest, written apparently in the fifth and fourth
centuries B.C., is entitled "Scylax of Caryanda, his
circumnavigation of the sea of the inhabited part of
Europe and Asia and Libya." It contains a systematic
description of the coasts of the Mediterranean, Black
Sea, and part of the west coast of Africa. The following
are some extracts which indicate the character
of the work. It is to be noted that no bearings are
given, and that distances are usually stated by day's
sail: Africa is referred to as Libya.
"Europe. I shall begin from the Pillars of Hercules
in Europe and continue to the Pillars of Hercules in
Libya, and as far as the land of the great Ethiopians.
The Pillars of Hercules are opposite each other, and are
distant from each other by one day's sail.... From
Thonis the voyage to Pharos, a desert island (good
harborage but no drinking water), is 150 stadia. In
Pharos are many harbors. But ships water at the
Marian mere, for it is drinkable.... From Chersonesus
is one day's sail; but from Naustathmus to
the harbor of Cyrene, 100 stadia. But from the harbor
to Cyrene, 80 stadia; for Cyrene is inland. These
harbors are always fit for putting into. And there are
other refuges at little islands, and anchorages and many
beaches, in the district between.... After the isthmus
is Carthage, a city of the Phœnicians, and a harbor.
Sailing along from Hermæa it is half a day to Carthage.
There are islands off the Hermæan cape, Pontia island
and Cosyrus. From Hermæa to Cosyrus is a day's
sail. Beyond the Hermæan cape, towards the rising
sun, are three islands belonging to this shore, inhabited
by Carthaginians; the city and harbor of Melite, the
city of Gaulus, and Lampas; this has two or three
towers.... The sailing along Libya from the Canopic
mouth in Egypt to the Pillars of Hercules ... takes
74 days if one coast round the bays.... From the
cape of Hermæa extend great reefs, that is, from Libya
towards Europe, not rising above the sea; it washes
over them at times.... From Thymiateria one sails
to cape Soloes, which juts far into the sea. But all
this district of Libya is very famous and very sacred....
This whole coasting from the Pillars of Hercules to
Cerne Island takes twelve days. The parts beyond the
isle of Cerne are no longer navigable because of shoals,
mud, and sea-weed. This sea-weed has the width of
a palm, and is sharp towards the points, so as to prick."
That there were many other similar writings in the
following centuries is shown by the following quotation
from Marcianus, in a preface to sailing directions
written in the fifth century A.D.: "This I write after
having gone through many sailing directions, and spent
much time on their examination. For it behooves all
who are men of education, to scrutinise such attempts
at learning in this subject, so as neither rashly to believe
the things that are said, nor incredulously to set their
private opinions against the careful decisions of others."
The oldest extant sailing directions of the middle
ages bear date 1306 to 1320.
Development of chart making. The application of
the compass to nautical use in the twelfth century
A.D. had a marked effect in encouraging voyages of
exploration, and therefore indirectly on chart making.
The following, written toward the close of the twelfth
century, is the first known mention of the use of the
compass in Europe: "The sailors, moreover, as they sail
over the sea, when in cloudy weather they cannot longer
profit by the light of the sun, or when the world is
wrapped in the darkness of the shades of night, and
they are ignorant to what part of the horizon the prow
is directed, place the needle over the magnet, which
is whirled round in a circle, until, when the motion
ceases, the point of it (the needle) looks to the north."
The nautical compass of that time appears to have
consisted of a magnetized needle, floated in a vessel
of water by a cork or reed, and having no index
nor compass card. Peregrinus in 1269 made notable
improvements in the compass, including a pivot suspension
for the needle, a graduation, a lubber line,
and an azimuth bar for sighting on the sun or other
object.
Nautical charts are known to have been in use since
the thirteenth century A.D., but the earliest extant of
which the date can be fixed is Vesconte's loxodromic
chart of 1311.
The loxodromic charts first appeared in Italy, and
were so called from the fact that they were crossed by
loxodromes (or rhumb lines) radiating from a number
of crossing points distributed regularly over the map.
Compass roses carefully drawn were later added at these
crossing points, the first appearing on a chart of 1375.
The earliest known mention of the variation of the
compass from true north was on the first voyage of
Columbus, who discovered this important fact in 1492,
and as a consequence his "seamen were terrified and
dismayed." Before that time it was assumed in Europe
that the compass pointed "true to the north pole."
The apparent failure to detect the variation earlier was
doubtless to some extent due to its small amount at
that time along the Mediterranean. The earlier charts
showed both lines and compass roses apparently
oriented with the true meridian, though there is some
evidence to indicate that they were actually oriented
with the magnetic meridian, the designer not recognizing
any difference. The variation of the compass was first
marked on a map in 1532 and on a printed chart in
1595, but the placing of magnetic compasses on charts
did not become customary until about fifty years ago.
These early charts were drawn on parchment, using
bright colors. They were copied by hand, one from
another, with gradual variations. They had no projections,
and the draftsmen evidently had no idea of
the sphericity of the earth. Islands and points were
usually exaggerated; shallows were indicated, but no
soundings; no information was given as to the interior
of the countries; a scale of distances was nearly always
provided.
Charts were first printed about 1477, and are known
to have been engraved on copper by 1560.
The maps of Ptolemy were ruled with degree lines,
but no chart was so provided until 1427; by 1500,
however, most charts were graduated. Before this
date it is not known on what projection the charts
were constructed. On the first graduated charts the
degree lines were equidistant parallel straight lines
cutting each other at right angles and thus dividing
the chart into equal squares or rectangles. These
were known as "plain charts." This square projection
had little to commend it save simplicity of construction,
as in higher latitudes it gave neither directions nor
distances correctly. The difficulties of its use in navigation
were early recognized, and nautical works contained
chapters on "sailing by the plain chart, and the
uncertainties thereof."
The example of early chart making shown in Fig. 2
is of great interest as being the earliest extant chart
which includes America. This chart was drawn on
ox-hide in 1500 by Juan de la Cosa, who accompanied
Columbus on his first voyage as master of his flagship,
and on his second voyage as cartographer. The chart,
of which only a portion is shown here, purports to
cover the entire world; it joins Asia and America as one
continent, the Pacific Ocean being then still unknown.
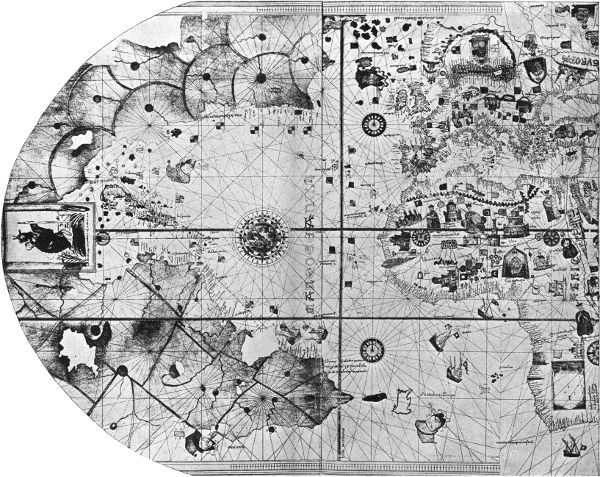
FIG. 2. CHART OF NORTH ATLANTIC OCEAN, BY JUAN DE LA COSA, 1500. EARLIEST EXTANT CHART SHOWING AMERICA.
Fig. 2 enlarged (652 kB)
Gerhard Krämer, a Flemish map-maker, better
known by his Latin name of Mercator, in 1569 published
his famous Universal Map. In this map the
meridians and parallels were still straight lines intersecting
at right angles, but the distances between the
parallels were increased with increasing latitude in
such proportion that a rhumb line, or line cutting the
meridians at a constant angle, would appear on the
map as a straight line. Mercator never explained
the construction of his chart, and as the above condition
was not accurately carried out, it is thought that the
chart was drawn by comparing a terrestrial globe
with a "plain chart." After examination of a mercator
chart in 1590, Edward Wright developed the correct
principles on which such a chart should be
constructed, and published in 1599 his treatise "The
Correction of Certain Errors in Navigation." It took
nearly a century to bring this chart into use, and even
in the middle of the eighteenth century nautical writers
complain that "some prefer the plain chart."
The Arcano del Mare, 1646, was the first marine
atlas in which all the maps were drawn on the mercator
projection.
In the sixteenth, seventeenth and eighteenth centuries
charts and sailing directions were often bound together
in large volumes. These usually had quaint titles, not
overburdened with modesty, of which the following is
an example: "The Lightning Columne, or Sea-Mirrour,
containing the Sea-Coasts of the Northern, Eastern,
and Western Navigation. Setting forth in divers
necessaire Sea-Cards, all the Ports, Rivers, Bayes,
Roads, Depths, and Sands. Very curiously placed on
its due Polus height furnished. With the Discoveries
of the chief Countries and on what Cours and Distance
they lay one from another. Never there to fore
so Clearly laid open, and here and there very diligently
bettered and augmented for the use of all Seamen.
As also the situation of the Northerly Countries, as
Islands, the Strate Davids, the Isle of Jan Mayen,
Bears Island, Old Greenland, Spitsbergen and Nova
Zembla. Adorneth with many Sea-Cards and Discoveries.
Gathered out of the Experiences and practice
of divers Pilots and Lovers of the famous Art of
Navigation. Where unto is added a brief Instruction
of the Art of Navigation, together with New Tables
of the Sun's Declination, with a new Almanach. At
Amsterdam. Printed by Casparus Loots-Man, Bookseller
in the Loots-Man, upon the Water. Anno 1697.
With Previlege for fiftheen years."
In 1633 a cartographer was appointed to the States-General
of Holland, and it was his duty to correct the
charts from the ships' logs. The Dutch at an early
date made important progress in publishing charts.
In 1720 there was established in Paris by order of the
king, a central chart office ("dépôt des cartes et plans,
journaux et mémoires concernant la navigation"), and
in 1737 the first charts were published by this office.
Detailed surveys of the coast of France were commenced
in 1816.
In 1740 "the commissioners for the discovery of
longitude at sea" were authorized by Parliament to
expend money on the survey of the coasts of Great
Britain, this commission having been created in 1713.
Various rewards were offered by this commission,
including one of £10,000, for the discovery of a method
of determining the longitude within 60 miles, an interesting
side light on the uncertainties of navigation at
that time. Compensated timepieces, which have been
so important a factor in improving navigation, were
invented by Harrison about 1761.
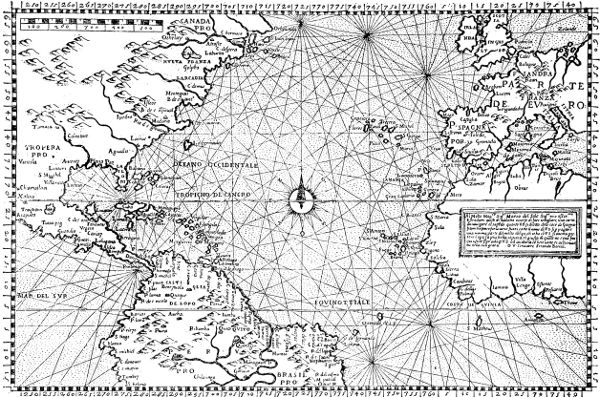
FIG. 3. LOXODROMIC CHART OF NORTH ATLANTIC OCEAN, 1565. A PLAIN CHART WITH LATITUDE DEGREES OF EQUAL LENGTH.
In 1795, by an Order in Council, a Hydrographical
Office was established in London, "to take charge and
custody of such plans and charts as then were, or should
thereafter be, deposited in the Admiralty, and to select
and compile such information as might appear to be
requisite for the purpose of improving navigation."
This office had at first one assistant and one draftsman.
Before that time many charts of a private or semiofficial
character had been published; the catalogue of
the East India Company in 1786 included 347 charts.
In 1807 the Congress of the United States authorized
the President "to cause a survey to be taken of the
coasts of the United States, in which shall be designated
the islands and shoals, with the roads or places of
anchorage, within twenty leagues of any part of the
shores of the United States; and also the respective
courses and distances between the principal capes, or
headlands, together with such other matters as he may
deem proper for completing an accurate chart of every
part of the coasts within the extent aforesaid." This
law was the origin of the present United States Coast
and Geodetic Survey, now under the Department of
Commerce and Labor.
In 1841 a systematic survey of the Great Lakes was
commenced; this is the Survey of the Northern and
Northwestern Lakes, briefly known as the Lake Survey,
conducted under the Corps of Engineers.
In 1866 the United States Hydrographic Office was
established under the Navy Department "for the
improvement of the means for navigating safely the
vessels of the Navy, and of the mercantile marine, by
providing under the authority of the Secretary of
the Navy, accurate and cheap nautical charts, sailing
directions, navigators, and manuals of instructions for
the use of all vessels of the United States, and for the
benefit and use of navigation generally."
Systematic surveying and chart making date back
little more than a century, and most of the information
shown on modern charts has been gathered in that
time. At present all the principal maritime nations of
the world have made, or are extending, careful surveys
of their own coasts.
Several of the countries have added valuable contributions
in the examination of other regions and oceanic
areas beyond their borders. The maritime and colonial
interests of Great Britain impelled that nation to carry
on extensive surveys along coasts whose inhabitants
were not prepared to do this work in the earlier days;
the British have made surveys along the coasts of Asia
and Africa and a part of South America, and the resulting
charts have been a very important and not sufficiently
known contribution to commercial intercourse
among the nations, as well as to geography.
The Dutch, French, Spanish, and other European
governments have made nautical surveys in various
parts of the world, largely in connection with their own
colonies, and in recent years much useful work has
been done by vessels of the German government. The
United States has also beyond its own territory made
valuable additions to hydrographic knowledge in the
work of officers of the Navy in a number of oceanic
exploring expeditions, and surveys on the coasts of
Mexico and in the West Indies, and in the explorations
of Fish Commission vessels.
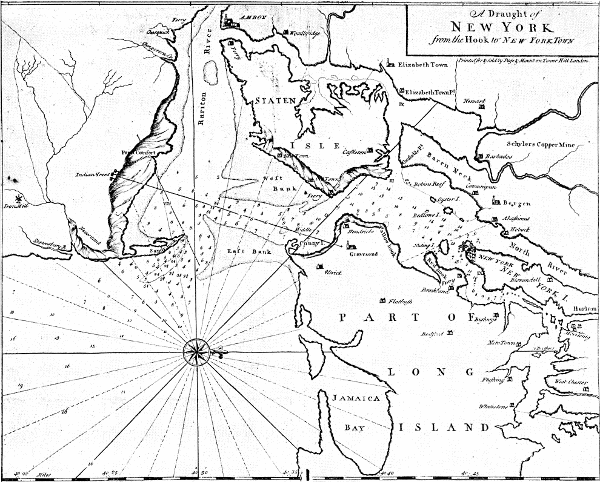
FIG. 4. EARLY CHART OF NEW YORK HARBOR, 1737.
Extension of maritime surveys. Of the total area of
the earth's surface, 51,886,000 square miles is land and
145,054,000 square miles is sea. The oceans thus
occupy nearly three-fourths of the whole surface, affording
highways open to the nations. To conduct international
commerce by water the ships of one country
must enter the ports of another. Thus both on the
open sea and in the harbors there is an interest, common
to seamen of all nationalities, in the advance of marine
surveys and in the publication of charts.
To keep the coasts properly charted, as well as lighted
and buoyed, is an obligation devolving on modern
nations, not only for the benefit of their own commerce
but for that of other countries.
As shown below, only a small part of the coast line
of the world is thoroughly surveyed. In the extensive
ocean areas which are dotted with islands or reefs, a large
amount of work is required for their sufficient charting,
although many doubtful areas have been cleared up in
recent years. Even the parts that are known to be of
depths so great as to be free from navigational dangers
should be sounded over sufficiently to develop the general
configuration of the ocean bottom.
Through international understanding a thorough
exploration of all the water area of the globe and the
coasts may in time be effected, and the many doubtful
spots which still disfigure the charts may be either
eliminated or definitely located.
Present state of progress of hydrographic surveys. A
comparatively small proportion of the coasts of the
world can be considered as completely surveyed at the
present time, and even such regions require much
additional revision. In the class of more thoroughly
surveyed coasts should be included the Atlantic and
most of the Pacific coast of the United States, Porto
Rico, nearly all the coasts of Europe, Algeria, and
portions of the coasts of Japan, the Philippine Islands,
and India.
A large part of the world's coasts has been surveyed
incompletely, but sufficiently well to permit the publication
of navigational charts. This is the condition as
respects most of southeastern Alaska and some other
portions of the Alaskan coast, British Columbia, most
of Mexico, Central America, the West Indies, Brazil
and parts of Chile, the Hawaiian Islands, China, Malay
Peninsula, Siam, the Dutch East Indies, Australia,
New Zealand, Persia, Arabia, most of Africa, Iceland,
northern Scandinavia, and Finland.
Another considerable portion of the coasts has not
been surveyed, but has been covered by explorations
which have been embodied in nautical charts of varied
degrees of incompleteness. In this class are the north
coast and considerable portions of the south and west
coasts of Alaska, the Aleutian Islands, Siberia, most of
the oceanic groups in the Pacific, the northern coasts
of Europe and North America, Greenland, the west
coast of South America, Venezuela, and Argentina.
Only a very small proportion of the total length of
coasts is now entirely unexplored, and such portions
are confined to the polar regions.
Chart publications of various nations. There are
about eighteen nations publishing navigational charts,
and adding to the information on which charts are
based. Many of these nations republish to some extent
the charts prepared by the others. Great Britain has
kept up a series of charts covering all parts of the world
and practically including in some form all information
published elsewhere. This series now (1908) includes
3725 different charts, of which the annual issue is
about 600,000 copies. France (1906) publishes 2948
different charts.
In the United States, charts are published by the
Coast and Geodetic Survey for the coasts and tidal
waters of the main country and the insular possessions,
by the Hydrographic Office for oceanic areas and foreign
coasts, and by the Lake Survey for the Great Lakes.
The total number of different charts issued by these
bureaus is about 2300, and the total annual issue is
about 225,000 copies.
Systems in use on various charts.
Longitude. The first chart of New York, published
by the Coast Survey in 1844, was referred to the City
Hall of New York as the initial longitude, and some
years ago it was the prevailing custom for each nation
to use a local initial longitude. While this satisfied
local pride it led to much geographical and navigational
confusion. Happily the charts of all countries
are now referred to Greenwich, with the following
exceptions:
France refers to Paris, which is 2° 20´ 15´´ E. of Greenwich.
Spain refers to San Fernando, which is 6° 12´ 20´´ W. of Greenwich.
Portugal refers to Lisbon, which is 9° 08´ 24´´ W. of Greenwich.
Units for depths. The English fathom or foot is used
for depths on the charts of Great Britain, the United
States, and Japan. Russia uses the sajene of seven
English feet. On the modern charts of practically all
the other countries the meter is used, though on older
charts various units are found.
In the first group feet are ordinarily found only on
large scale or local charts of areas with moderate
depths, and the other charts are in fathoms, except
that on the earlier charts of the Coast and Geodetic
Survey feet were used on a sanded surface inside of the
three-fathom curve and fathoms on the white surface
outside of that curve. Heights are stated in feet on
the charts of the first group.
Plane of reference. As the depth of water varies
with the tide, it is necessary for charting purposes to
adopt some standard plane to which the soundings are
referred. Practically all countries have adopted for
this purpose a low stage of the tide, as this is obviously
on the side of safety; in most cases an extreme low
water is used, so that the actual depths will seldom,
owing to the tide, be less than those shown on the chart.
The definite reference planes used on the American
charts will be mentioned later.
On nearly all charts heights are referred to mean high
water, doubtless owing to this being the visible limit of
the land at high tide. On topographic maps of the
interior, the heights are referred to mean sea level,
which plane is of course lower than the preceding by
one-half the range of tide.
Symbols on charts. Fair uniformity as to general
principles, with differences as to details in carrying
them out, exists on the various series of charts regarding
their general arrangement and the more important
symbols, such as in the shading of land to distinguish
from water, the use of depth curves, the representation
of hills by shade or contour, the indication of shoals
and dangers, and of lighthouses and buoys.
Desirability of uniformity in charts. Ships engaged
in international commerce must enter foreign ports.
As the information is constantly changing and charts
are being corrected or improved, it is sometimes
desirable for the navigator to consult the local foreign
charts, and it may often be necessary for him to carry
in his chart room the charts of several different countries.
There are therefore important advantages in
international uniformity in chart publication.
There should be a common initial longitude, and as
the longitude of Greenwich has been so extensively
adopted, it appears quite probable that its use may
some day become universal.
A common unit for soundings and heights would be
very desirable, but the fact that a large group of nations
has united on the metric system, while a small group
with great commercial interests retains another system,
makes the attainment of uniformity difficult.
Substantial agreement as to the use of symbols on
charts, particularly such as represent aids or dangers
to navigation, would be desirable and doubtless feasible.
Privately published charts. Many of the earlier charts
were prepared and published by private enterprise, and
such charts are still published, as, for instance, the so-called
"blue-back" charts printed in London. These
charts have usually differed from those published by
the various governments either in representing the main
features in a very bold manner with little detail or in
including a considerable area with many plans on a
single large sheet backed for permanency. An objection
to the latter is that the durability together with the
high price tends to keep an old chart in use long after
it is out of date. It would be financially difficult for
a private firm to give the service that a government does
in the matter of correcting the charts and issuing new
editions, and this is an important consideration in the
selection of charts.
Purpose of charts. The main purpose of charts is to
furnish graphical guides to aid in taking a vessel safely
from one port to another; they are maps for the use of
navigators. An experienced mariner may be able to
steer his vessel over a familiar course without charts,
but this does not make their publication less necessary.
Even such an expert pilot doubtless studied the charts
in the first place; the uncertainties of the sea and
the changes of information are such that his vessel's
equipment should include the latest charts, and safety
requires their examination. The passengers and the
merchants who intrust their lives or their goods to the
sea are largely dependent upon the correctness of
the charts.
Besides their main purpose charts fill many other
needs, among which are; for preliminary planning of
harbor improvements and various engineering works,
for defensive works and other military uses, for the
fishing interests, and for general information as to the
coastal regions. Charts will furnish much of interest
and instruction to the traveler by sea and the dweller
near the coast, who will learn to read them. Passenger
steamers should more often for the interest of their
patrons display charts of the waters traversed. No
written or verbal description can give as clear an idea
of geographical features and relations as a good map
or chart.
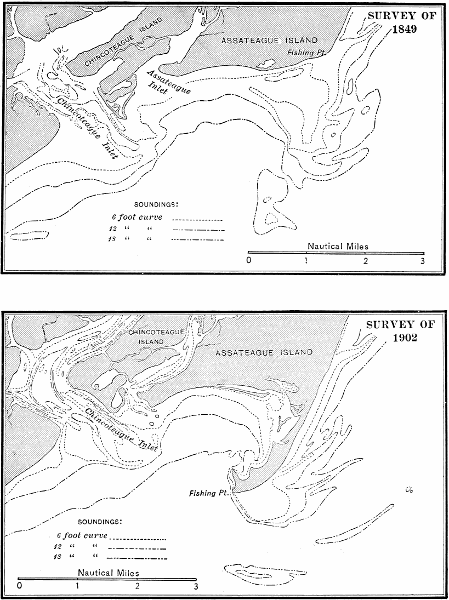
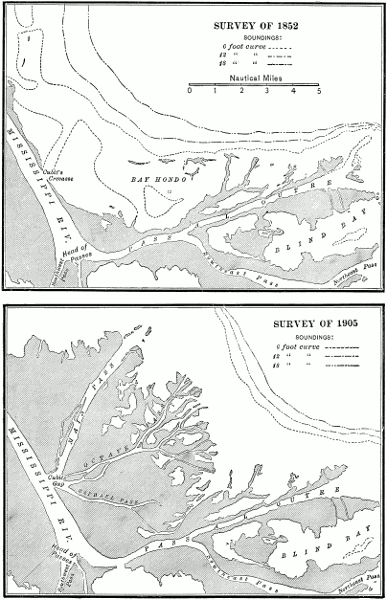
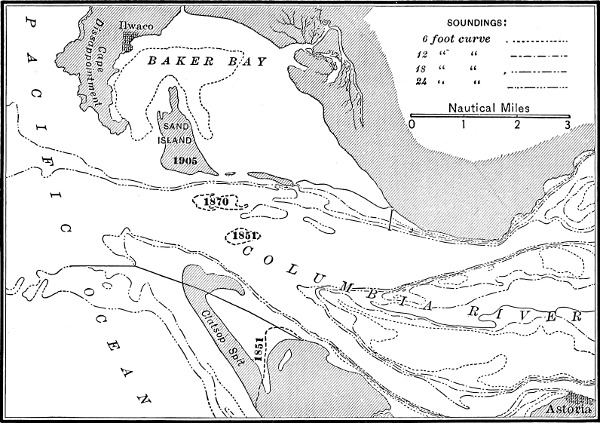
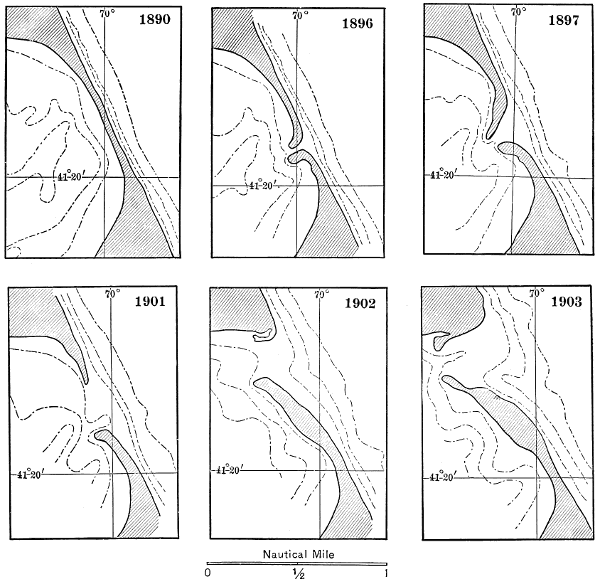
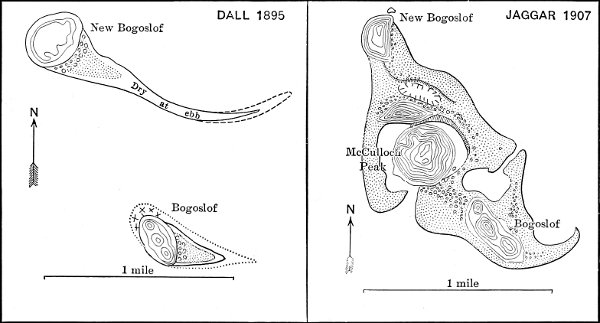
As the charts are revised from time to time, a comparison
of editions at different dates furnishes a record
of the changes wrought by nature or man, and this is
especially useful in studying the action in many harbor
and river entrances, as well as for historical purposes.
Requirements for charts. As charts are maps of the
water areas, including the adjoining land, and intended
primarily for the use of mariners, they differ in important
respects from topographic maps or general maps,
even such as include the water areas. The main
requirements for charts are these; correct and complete
information, early publication of new data, clear and
intelligible representation of the information, convenient
arrangement as navigational instruments, and high
standard of publication.
The special and sometimes difficult conditions under
which charts must be used on shipboard call for good
judgment throughout their preparation. Even the
paper on which they are printed is of importance, in
order that they may be sufficiently durable and suitable
for plotting.
Information given on charts. It is evident that it is
impossible to represent on a chart of any practicable
scale all the features that exist on the corresponding
area of the earth's surface. It is essential, therefore,
that a selection be made of the classes of facts that are
to be shown, as well as of the detail that is to be used for
each class. The practical utility of the chart depends
largely on the good judgment used in this selection. In
the information shown, charts differ from maps principally
in representing by soundings and curves the
configuration of the bottom of the water area, and in
showing ordinarily the topographic features only in the
vicinity of the coast line.
The convenience of mariners should govern in the selection
and arrangement of the information to be shown
on charts, though they may be made useful for other
purposes so long as this convenience is not lessened.
The needs and preferences of navigators alone, however,
differ so much that a reasonable chart must be
somewhat of a compromise between conflicting views.
For certain classes of navigation a boldly drawn chart
showing only the dangers and a few other soundings
and some landmarks might be useful. For other
maritime purposes a more detailed chart would be
valuable. The first, however, would fail to give facts
often demanded in the navigational use of the chart,
and the second if carried to an extreme would make a
chart difficult to use.
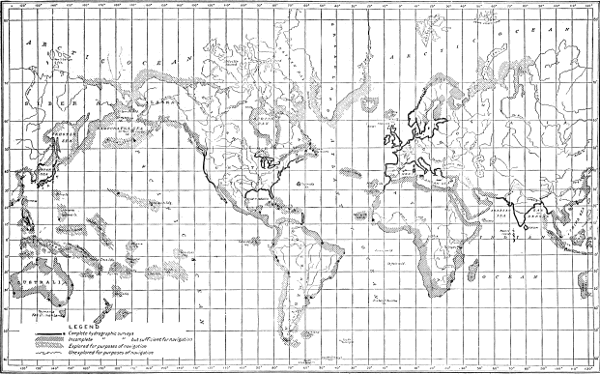
FIG. 5. STATE OF ADVANCEMENT OF HYDROGRAPHIC SURVEYS OF THE COASTS OF THE WORLD, 1904.
By G. W. Littlehales.
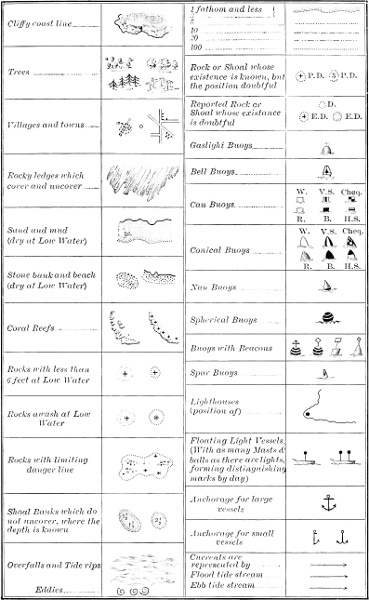
Shoals and dangers are shown either by the least
depth or by rock or reef symbols. The characteristic
soundings are shown on the chart, with abbreviations
indicating the nature of the bottom. Depth curves
are drawn, joining together points of like depth, and
inclosing areas of less depth, on the same principle
that contours are used on land maps; usually also the
shoaler spots are made more prominent by sanding
or tinting the area within them. Lighthouses, buoys,
and other artificial aids to navigation are represented,
with descriptive abbreviations. The coast is shown
by a bold solid line for high water and a dotted line
for low water. The main topographic features are
represented for a moderate distance from the coast,
with such detail as is useful, depending on the scale of
the chart. Elevations are given in figures for prominent
summits, islands, and rocks; the general configuration
of hills and mountains is represented by contours
on large scale charts or by hachures or shading on
small scale charts. Rivers, streams, lakes, marshes,
towns, roads, prominent buildings, and other important
topographic features are shown by appropriate symbols.
It is important that objects which may be useful in
navigation as landmarks, whether natural or artificial,
be plainly shown and described, if necessary to their
identification, and that they should not be obscured
by details of lesser importance. On the larger scale
charts only, vegetation features, particularly areas
covered by trees, are represented by symbols. The
land area is usually clearly distinguished from the
water area by a tint or stipple. Latitude and longitude
are given by the projection lines and the subdivided
border, or sometimes on harbor plans by a note giving
the position of some one point. Brief information as
to the time and range of the tides is stated in a note.
Data regarding currents, whether due to tidal or other
causes, are given by current arrows placed on the chart,
or by explanatory notes. Compasses are for convenience
printed on the charts, and data given as to the
magnetic variation and its rate of change. On large
scale charts scales are provided for use in measuring
distances. Ranges and channel lines are given when
required. The ports are indicated where storm warning
signals are displayed. The areas of forbidden anchorages
are shown, and when important, the positions of
submarine cables. The lines dividing the high seas
from inland waters are sometimes stated on United
States charts. Life saving stations are given, and time
balls are usually noted. Views of important features
are shown on some charts.
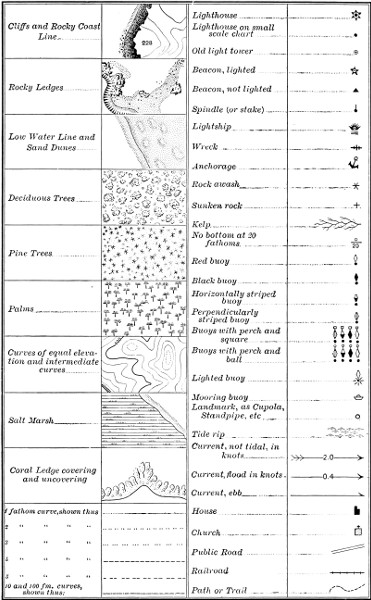
FIG. 6. SYMBOLS USED ON CHARTS OF THE UNITED STATES COAST AND
GEODETIC SURVEY.
The layman who looks at the printed chart probably
does not appreciate the amount or the variety of
information that must be gathered and sifted and put
in proper shape for a single chart.